For space requirements this blog has been split in 4 parts:
In continuation to previous blog in this blog I am going to show step by step procedure to display hierarchies in S/4 using analytical CDS views. I will use manger employee hierarchy as an example here.
To achieve this you need:
A dimension view with an employee as key, and his manager as attribute, and optionally some time-dependency information; this view gets the @Hierarchy annotations. An analytical cube with the employee as dimension attribute, other attributes, and the relevant measures (actual/planned working hours etc). An analytical query that takes a manager as input and uses it as root of the hierarchy.
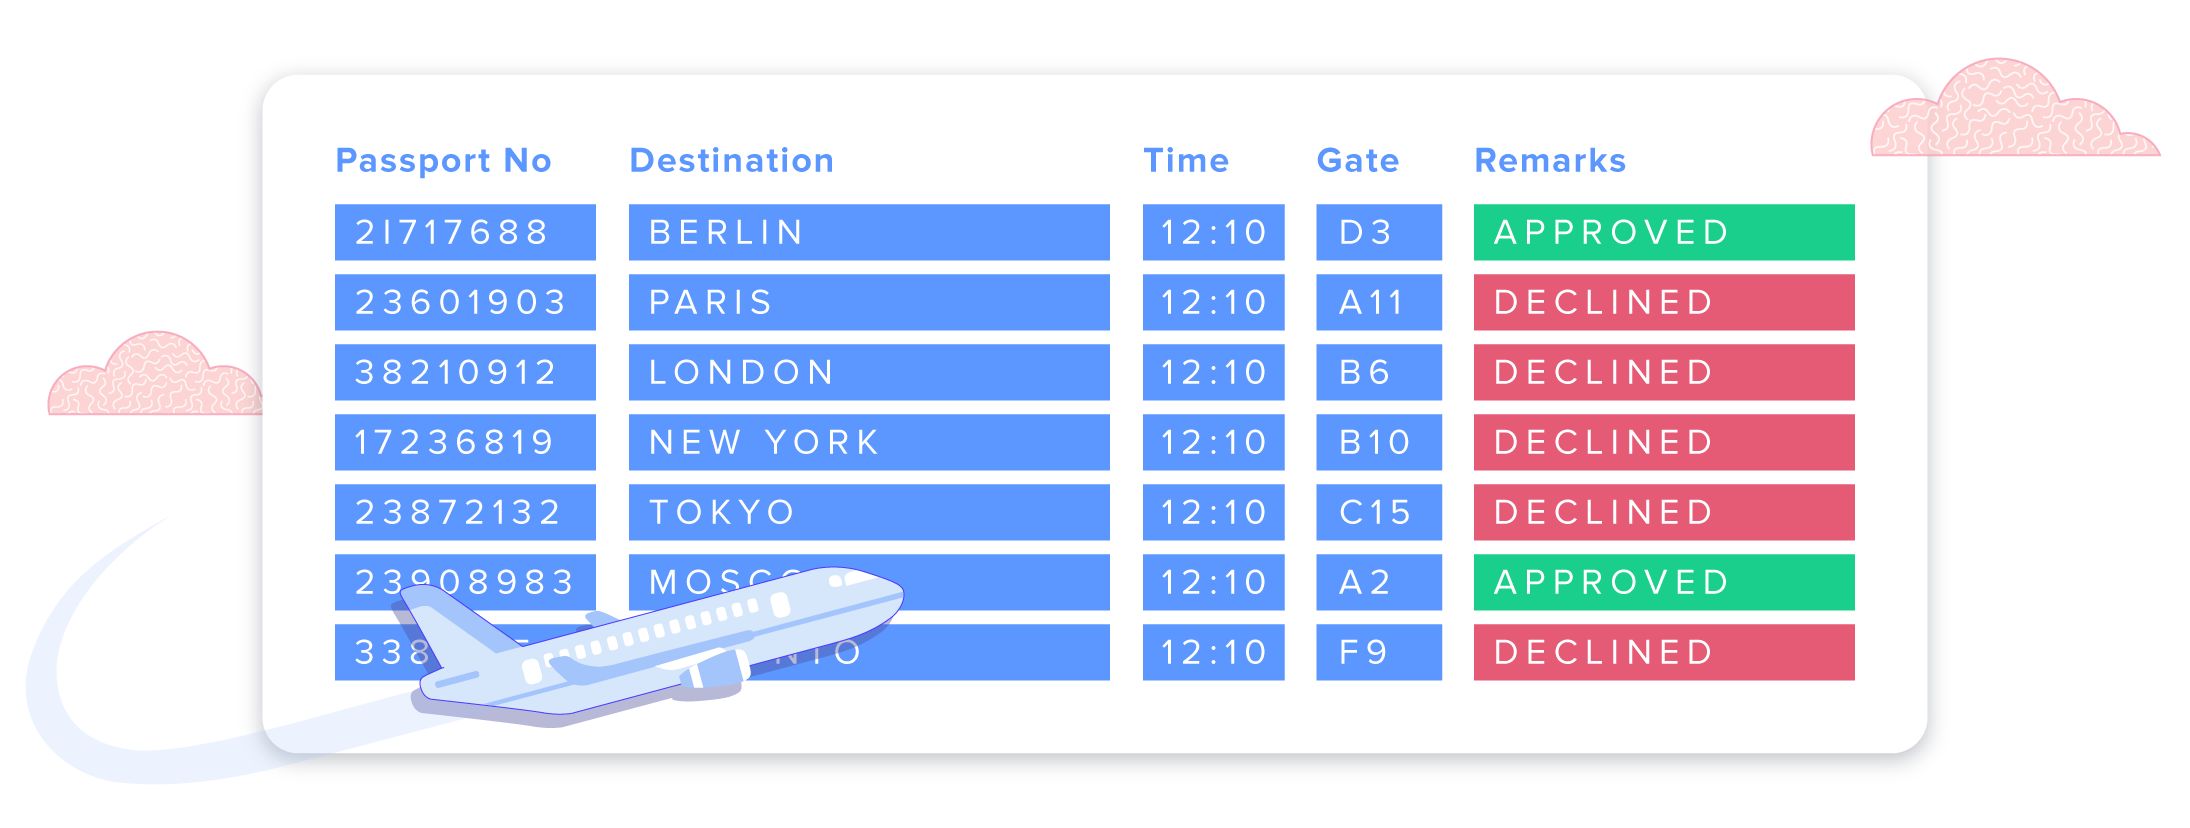
The following diagrams show high level architecture of these views and their relations, as well as an example of a simple representation.
The display would then show a tree structure of the employees below the manager, with sub-ordinate managers as hierarchy nodes.
Below are the steps to be followed to display S/4 hierarchies using CDS views:
1. Construction of Employee Manager Sample hierarchy: if you have hierarchy already in place you can skip this step otherwise you can check my previous blog for evaluating the hierarchy using CDS table function.
Below is the sample code for constructing hierarchy:
2. Dimension View Creation: Before Creating dimension view you need to know what is dimension view, View becomes dimension view if data category annotation @Analytics.dataCategory:#Dimension is specified. By specifying the dataCategory the developer can give directives and hints to an analytical engine how to interpret individual entities.
Dimension definition: A collection of similar data which, together with other such collections, forms the structure of a cube. Typical dimensions include time, product, and geography. Each dimension may be organized into a basic parent-child hierarchy or, if supported by the data source, a hierarchy of levels. For example, a geography dimension might include levels for continent, country, state, and city.
Below is the sample code for dimension view:
if you observe the code there is self association(view name ZEMH_I_Employee and association name is same) with cardinality [1 : 0..1] pointing to the parent node of the node is written which is mandatory in the dimension view which is used for recursion of Manger and employee.
Testing Dimension View: Tcode- RSRTS_ODP_DIS
Select ODP Context as ABAP Core Data Services and ODP Name as Dimension SQL View name ZEMH_IE as shown below and execute
Then you will see the dimension view structure, click on standard query button as below to test the output in query monitor
Result is shown as below:
Every analytical view whether it is a dimension, fact, cube or query view attributes has row, column and free characteristics. You can test by moving the attributes from free to row by clicking on down arrow as shown above.
if you find empty values move the attributes free to row then you will get the result.
3. Cube View Creation: Cube view indicates a star schema. Usually it is used for a "View Entity" with a "Fact Entity"(View) in the center and "Dimension Entities"(View) around. View becomes cube view if annotation @Analytics.dataCategory: #CUBE is specified.
Fact Entity(view) indicates that the entity represents transactional data. Usually it contains the measures. So first we have to create a fact view which has measures for employee such as actual and planned working hours.
Below is the sample code for fact view:
Below is the sample code for cube view:
In the above cube view "ZEMH_P_EmployeeHours" is fact view contains measures which is used as data source and it has association to "ZEMH_I_Employee" dimension view which is created in step 2. This association is mandatory which represents association from dimension view to cube view, anchors hierarchy to cube view.
Annotation @DefaultAggregation: #SUM determines aggregated measure which result summation of planned and actual hours for employee.
Testing Cube View: Tcode- RSRTS_ODP_DIS
Repeat the Testing Dimension View in step2 for testing cube view results. Results would like below:
Sum of actual and planned hours is displayed as above in the cube result.
In the next blog define analytical query CDS Views I will show Analytical query consumption view which uses cube view and generates the hierarchy.
Your suggestions, feedback, comments on this blog are most welcome.
,农业物联网,企业信息化管理软件,生态环境大数据,大数据是干嘛的,淘客选品